


Is Carville’s “economy, stupid” maxim dead?
Misery index says yes. But, add 1 word. “Economic vibes, stupid” decide the presidency.

Photo credit: JD Lasica/Socialmedia.biz
Stone cold takes (from the 5th stage of grief)
Peter Coy of the New York Times dismissed James Carville’s presidential election guide with “‘The Economy, Stupid’? Not So Much Anymore.”
Kamala Harris losing with the 2nd-best economic misery index (inflation + unemployment) in 50 years would seem to confirm Coy’s diss of Carville.
Carville’s theory lives on by adding one word. “Economic vibes, stupid” explain whether the incumbent party will retain the White House.
Harris lost with the 4th-worst economic vibes in 19 elections back to 1952.
Vibes were low even though the main economic data looked good because confidence had not recovered after the high inflation of 2021-2022.
Readers who reach the end will be rewarded by my take on a Ferlinghetti poem.
Biden legacy: 2nd-best economic misery index since 1960s
Throughout the campaign, top economist Justin Wolfers tweeted the latest good news about the American economy. For example, on the Friday before voting day, the Bureau of Labor Statistics (BLS) reported that the unemployment rate was unchanged at 4.1%. Professor Wolfers reminded his 225,000+ followers:
The “misery index” is at almost the lowest level for any presidential election cycle in the past fifty years. The “Misery index” = Inflation rate + Unemployment rate’

Last week BLS reported that the annual inflation rate was up slightly to 2.7% for November 2024. Adding inflation to the November unemployment rate of 4.2% reported earlier, the election-month misery index for 2024 is 6.9 – a bit higher than in Wolfers’ pre-election tweet based on data available on November 1st. But, Wolfers is still right that the 2024 misery index was 2nd-best in 14 presidential elections going back more than 50 years to 1972.
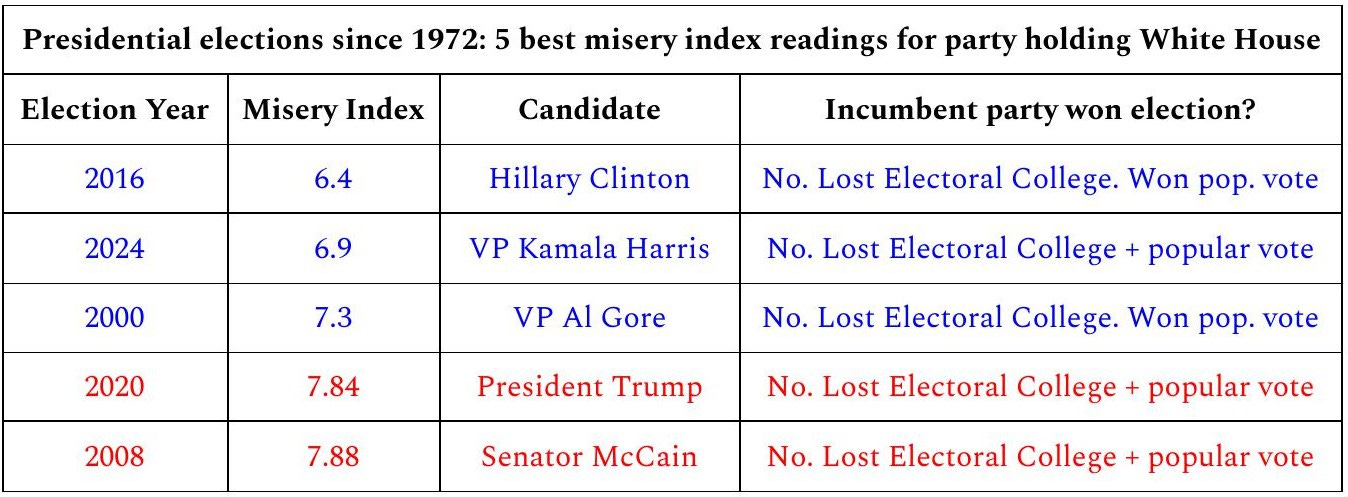
Economic misery index and presidential election winners
Now that the 2024 presidential election is over, I have 3 take-aways from Professor Wolfers’ chart about the misery index and presidential elections.
A good misery index is NOT a sign that the party in power will keep the White House. Looking at Wolfers’ chart, we can see that the party holding the presidency lost when the misery index was lowest.

Sources: @Justin Wolfers Nov. 1, 2024 from BLS data except for this author’s calculation of unemployment and inflation data to 2 decimal places to break 2008-2020 tie and 2024 misery index updated to November.
However, in the last ¼ of the 20th century, the misery index was indeed the 1 key to the White House. The change in the misery index tipped the winner in 6 consecutive elections from 1976 to 1996. For those elections, Professor Allan Lichtman did not need all 13 key indicators that he uses in his presidential prediction model. (Btw, Lichtman’s 13 keys were wrong in 2024.) When the misery index rose between elections – in other words, the economy got worse, incumbent presidents lost in 1976, 1980 and 1992. When the misery index fell between elections – in other words, the economy improved, then the party holding the White House won in 1984, 1988 and 1996. James Carville didn’t cite the misery index when he hung his “The economy, stupid.” sign on the wall of his boss Bill Clinton’s 1992 campaign headquarters. But, Carville’s 1992 reminder to Clinton campaign workers may well have been prompted by his intuition that inflation and unemployment were decisive issues in the presidential races of the 1970s and 1980s. Carville was right that the bad economy would help the Democrats defeat President George HW Bush in 1992 and right again that the improved economy would re-elect Clinton in 1996.
So far in the 21st century, the previous relationship between presidential election outcomes and the change in the misery index has all but vanished. In 7 elections from 2000 to 2024, the 1976-1996 pattern held up just once. Trump lost in 2020 with the misery index higher than when he was elected in 2016. In 2004 and 2012, incumbent presidents were re-elected even with the misery index worsening over their 1st terms. And, in 2000, 2008, 2016 and again in 2024, the party holding the White House lost despite the misery index improving between elections.
Updating Carville: “Economic vibes, stupid”
James Carville’s 1992 insight about presidential elections is NOT dead. Resurrecting Carville requires a small tweak to his original formulation of “The economy, stupid.”
What is the best indicator of whether the party holding the White House will keep it? Economic vibes, stupid.
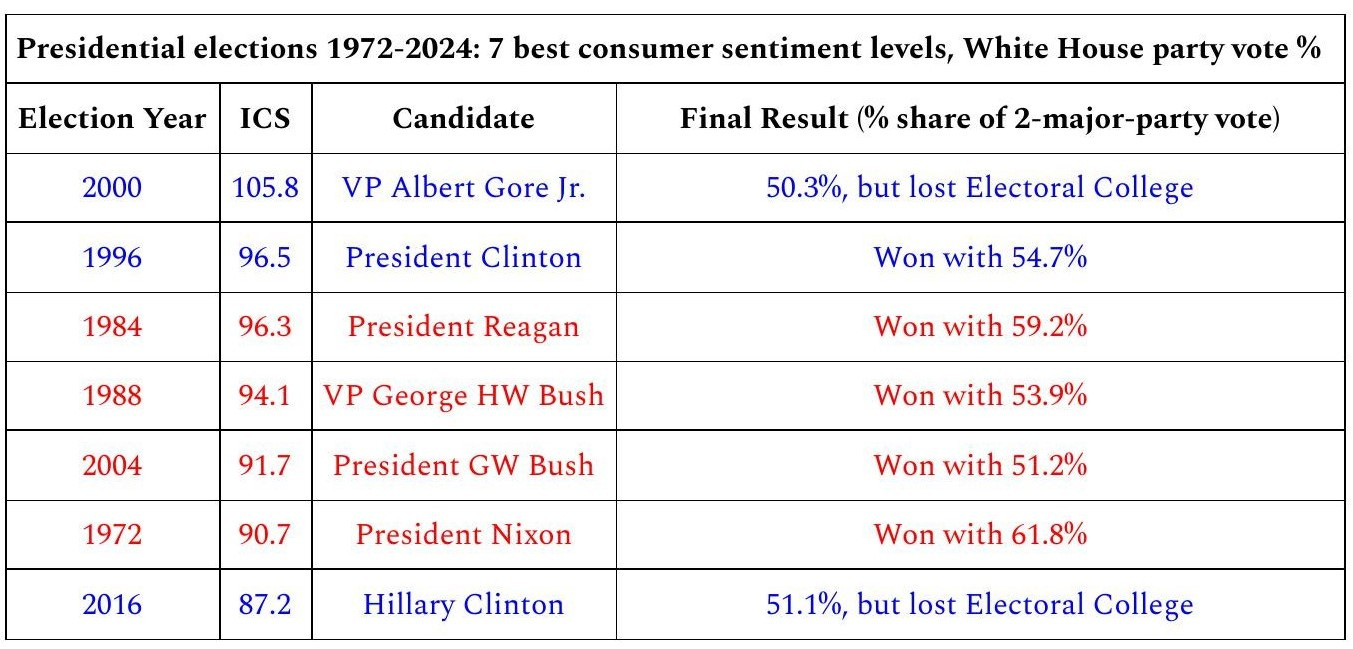
The University of Michigan’s Index of Consumer Sentiment (ICS) for October just before the presidential election tells us how voters are feeling about the economy and the White House party’s management of the economy.
The party holding the White House lost all 5 elections when the November misery index was best (lowest) in Professor Wolfers’ 1972-2024 chart. By contrast, the party in power won the national popular vote in all 7 contests when consumer sentiment was best (highest) ahead of the election. While it’s true that 2 of those popular vote winners lost the Electoral College – Al Gore in 2000 and Hillary Clinton in 2016, consumer optimism was associated with 5 of 7 Electoral College winners.
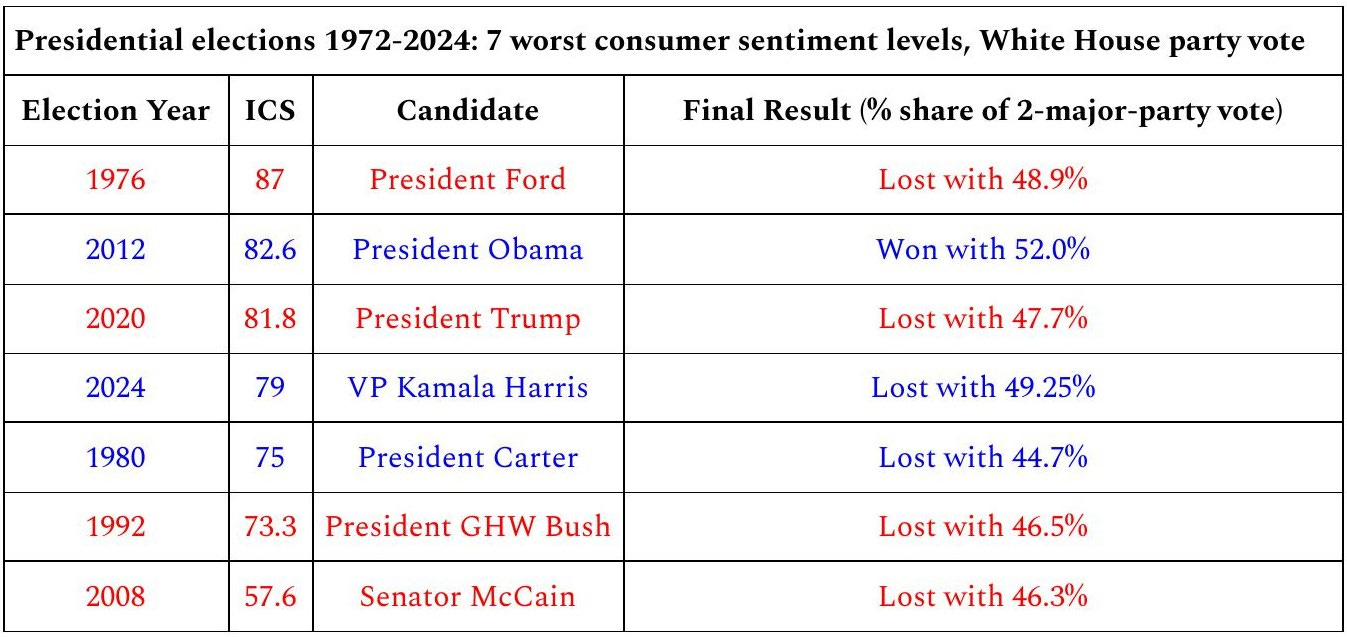
The flip side is that the incumbent party lost 6 of 7 elections when sentiment was lowest before voting day. To their sorrow, the Kamala Harris Democrats proved yet again that it’s very difficult for the incumbent to win in the face of low economic vibes.
Sources: ICS (= Index of Consumer Sentiment) in October just before each November election. October 2024 reading is based on this author’s calculation of the adjustment necessary to render ICS comparable to readings before the April 2024 change in survey methodology. 1976, 1972 = November. No October readings those years.
Note: Share of the 2-party vote is a more meaningful measure than share of total votes including minor parties.
Why were vibes low when the 2024 economy looked good?
The low economic vibes that defeated Kamala Harris can be traced back to the vibecession of 2021-22 first identified by Kyla Scanlon. According to Scanlon:
“Vibecession - a period of temporary vibe decline where economic data such as trade and industrial activity are relatively okayish” (June 2022)
“A vibecession is a disconnect between consumer sentiment and economic data.” (August 2024)
I define “vibecession” in numbers as follows:
“The United States is in a state of vibecession when there is a significant decline of at least 20% over a period of 3 years or less in the 3-month average of the ICS reported by the University of Michigan IF the NBER Business Cycle Dating Committee has NOT announced that an economic recession has occurred… If NBER later announces that an economic recession occurred either during the period of ICS decline or that the recession began within 12 months after the ICS trough, the vibecession declaration shall be nullified by NBER’s recession call.”
A vibecession is exactly what happened starting in the summer of 2021. The Index of Consumer Sentiment (ICS) dropped 38 per cent from June 2021 to August 2022. ICS hit an all-time low in the summer of 2022 – lower than at any time in 72 years that University of Michigan has reported consumer sentiment.
Yet, there was no economic recession in 2021 or 2022. Nor has there been a recession since then. The 38 per cent fall in ICS during the no-recession vibecession of 2021-22 was steeper than the consumer sentiment declines associated with 8 of the 11 recessions since 1950.
After hitting rock bottom in the summer of 2022, consumer sentiment has been in a state of vibecovery – defined by this author as a rising ICS trend after a no-recession vibecession. By October 2024, ICS was up almost 50 per cent from the vibecession trough in August 2022.
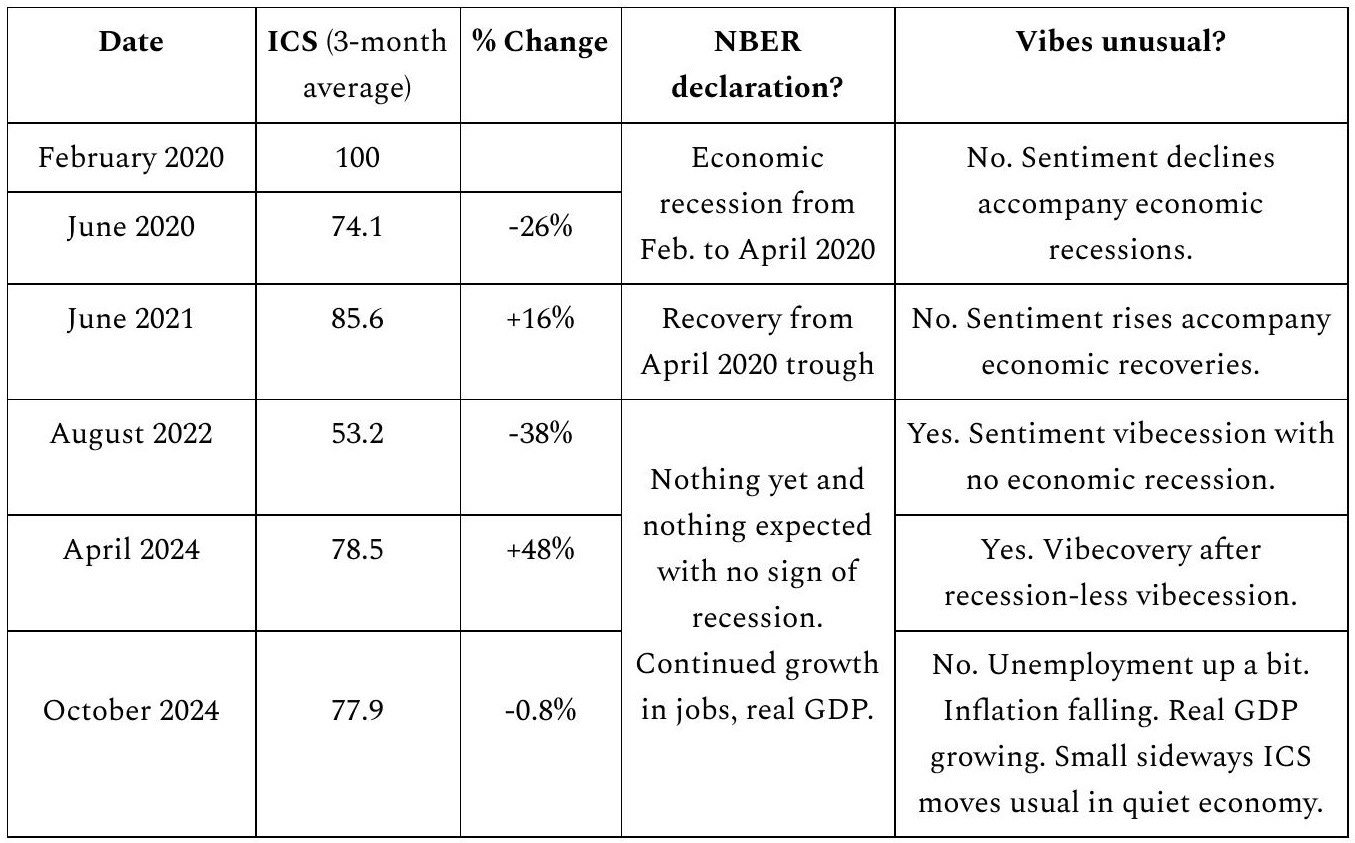
Unfortunately for Kamala Harris and the Democratic party, the 2021-22 vibecession was deep and the subsequent vibecovery was not strong enough to lift consumer sentiment higher than ICS = 79 by October 2024. No incumbent party has ever kept the White House with ICS below 82.6 – Obama's 2012 re-election.
Why did Harris lose in 2024 when Obama won in 2012?
If we look back to Professor Wolfers’ chart near the start of this post, we see that President Obama was re-elected in 2012 with the misery index at 9.5 – the worst election-month level since George Bush the Elder lost by a wide margin in 1992.
Why did Vice President Harris just lose with a much better misery index at 6.9?
David Leonhardt and Nate Cohn argued in the NYTimes that Obama was a better campaigner than Harris, particularly at reaching voters without a college degree.
I agree that Barack Obama was a better politician than Kamala Harris.
But, we should also recognize that Obama benefited from better economic vibes in 2012 than Harris did in 2024.
Both Democratic administrations were hit by no-recession vibecessions. But, the 2011 vibecession was not as deep as 2021-22 (-21% vs. -38%). The consumer sentiment bottom was not as low in 2011 (58.7) as in 2022 (53.2 = 3-month average).
Both vibecoveries slipped back for a few months during the election year before consumer sentiment moved higher in the months before voting day. But, ICS bounced off its election-year low by more in 2012 than in 2024: +14% vs. +8%.
With a weaker vibecession and stronger election-year vibecovery, Obama was re-elected in 2012 with ICS at 82.6. Harris lost in 2024 with ICS at 79.
Last but not least, Obama benefited from running for re-election as an elected President. Of American presidents nominated for re-election by their parties, ⅔ won another term in both modern and distant times. Kamala Harris was the 5th sitting vice president to be nominated for the presidency since World War II. Only George HW Bush won. The evidence, albeit limited and not statistically significant, is that vice presidents do not receive the “deserves another chance” allowance that some voters grant to incumbent presidents.
Imagine an alternate universe in which Vice President Barack Obama had been tasked with salvaging the Democrats’ 2024 campaign against Trump. Obama might have won more votes than Harris. But, would his campaign skills have been enough to overcome gloomy economic vibes and secure enough votes to defeat Trump?
Why were economic vibes so low in 2024?
As Professor Wolfers highlighted, the 2024 economic misery index was 2nd-best in 14 elections going back to 1972. But, economic vibes as measured by the Index of Consumer Sentiment (ICS) were 4th-worst. Bad economic vibes trumped good economic data and Harris lost.
Borrowing Kyla Scanlon’s description, why the “disconnect between consumer sentiment and economic data”?
The 2021-2022 vibecession was not a mass delusion. There was not a disconnect between consumer sentiment and all economic data.
It’s true that there was no recession. Job growth continued and the unemployment rate fell. There was a disconnect between consumer sentiment and the job market.
However, there’s more to consumer sentiment than the job market. Production paused during the first half of 2022. Real, inflation-adjusted Gross Domestic Product (GDP) fell 0.4% at an annualized rate. And, likely even worse for sentiment, inflation soared to 9.1% in June 2022 – up from 1.4% when Trump left office in January 2021. The June 2022 misery index hit 12.7 – up from 7.8 when Trump left the presidency, though down from 15.1 in April 2020 during the covid recession.
The vibecession – the 38% plunge in consumer sentiment from June 2021 to August 2022 – coincided with inflation rising and growth stalling. The vibecovery in consumer sentiment began in autumn 2022 as inflation subsided and economic growth resumed.
By March 2024, consumer sentiment was up by almost 50% from the vibecession bottom. But, over the next 6 months until the election, consumer sentiment effectively stalled. ICS dipped this spring before rising slowly to get back to the level where it started the year. This pause in the vibecovery left October ICS at 79 – a below-average level at which no incumbent administration had ever before kept the White House.
Explaining low economic vibes in 2024
Professor Robert Gordon and his colleagues highlight the importance of what they call “excess inflation” =
“extra inflation in the current Presidential term relative to the cumulative inflation in the previous term”
Annual inflation as measured by the Consumer Price Index (CPI) averaged 5% during Biden’s presidency up to November 2024 vs. 1.8% during Trump’s 1st term. This was the worst rise in inflation since the Carter presidency.
Gordon and company find that "excess inflation” plays a large role in consumer sentiment, the president’s approval rating and whether the party holding the White House keeps it.
Why would voters have still been upset about average inflation of 5% due to the high rates of 2021 and 2022 and not reassured that the annual rate had fallen below 3% by the November 2024 election?
One obvious reason is that Kamala Harris had to defend prices in 2024 that still seemed high compared to much lower levels when Trump left office. Adding to consumer angst at the grocery store and gas station, personal lending rates for home mortgages and vehicles remained much higher than when the Donald flew his White House coop by helicopter on January 20, 2021. Higher auto lending rates, in particular, may have stuck in the craw of Trump’s “bro brigade” of young dudes.
Earlier this year, Professor Lawrence Summers and his colleagues suggested that standard measures do not reflect fully the misery inflicted by inflation when lending rates increase. According to Summers:
‘I don’t think the purpose of the CPI (Consumer Price Index) is to predict people’s sentiment… You cannot assume from a low CPI that consumers are feeling that life is affordable.’
Summary
Kamala Harris lost a close election race to Donald Trump even though the economy as measured by the unemployment and inflation rates looked better than when Trump left office. “Economic data, stupid” failed to predict the outcome. But, “economic vibes, stupid” did.
Voters weren’t stupid to have low vibes about the economy even though the main economic numbers looked good. There are rational explanations for why American voters were still feeling blue two years after inflation started falling.
Carville’s theory of presidential elections lives on once we recognize that economic vibes are more complicated than just looking at the economic data on election day.
Elitist poetry take: Kamala’s Trojan Horse
After Lawrence Ferlinghetti’s Trump's Trojan Horse (2017).
Lawrence didn’t live long enough
To witness Trump’s return.
America’s economy,
For Harris was a Trojan horse.
All the numbers looked good,
Except the most important one.
Prices trumped democracy.